Prometheus
Overview
This installation happens on the
dsb-node-01.
According to Prometheus' Website, Prometheus is an open-source systems monitoring and alerting toolkit originally built at SoundCloud. It is designed for reliability and scalability, collecting metrics from configured targets at given intervals, evaluating rule expressions, displaying the results, and triggering alerts if needed. This guide will walk you through the steps to install and configure Prometheus using Docker Compose on your system.
Prerequisites
-
Install Docker
-
Install Docker using Snap:
sudo snap install docker
-
-
Create Docker Group and Add User to It
-
Create a Docker group and add your user to it:
sudo groupadd docker
sudo usermod -aG docker $USER
sudo reboot
-
Installation Steps
-
Create a Docker-Compose File for Prometheus
-
Create the necessary directories and Docker Compose file:
mkdir -p ~/apps/prometheus
touch ~/apps/prometheus/docker-compose.yml
-
-
Copy and Save the Docker-Compose Configuration
-
Use the following configuration in your
docker-compose.ymlfile:version: "3.7"
services:
prometheus:
image: prom/prometheus:latest
container_name: prometheus
volumes:
- prometheus_data:/prometheus
- ./prometheus.yml:/etc/prometheus/prometheus.yml
ports:
- "9090:9090"
restart: always
network_mode: host
volumes:
prometheus_data: -
Open the file with nano or your preferred text editor and paste the configuration:
nano ~/apps/prometheus/docker-compose.yml -
Save and close the file.
-
-
Create a Custom
prometheus.ymlFile-
Create the
prometheus.ymlfile in the Prometheus directory:touch ~/apps/prometheus/prometheus.yml -
Add the following configuration to the
prometheus.ymlfile:global:
scrape_interval: 15s
evaluation_interval: 15s
scrape_configs:
- job_name: "cadvisor"
static_configs:
- targets: ["localhost:8080"]
- job_name: "node_exporter"
static_configs:
- targets: ["localhost:9100"]
- job_name: "jenkins"
metrics_path: /prometheus/
static_configs:
- targets: ["<your_ip_address>:8080"]ملاحظةThis configuration sets up Prometheus to scrape metrics from cAdvisor, Node Exporter, and Jenkins. Replace
<your_ip_address>with the actual IP address of your Jenkins server.
-
-
Run Prometheus with Docker-Compose
-
Navigate to the Prometheus directory and run the container:
cd ~/apps/prometheus
docker-compose up -d
-
-
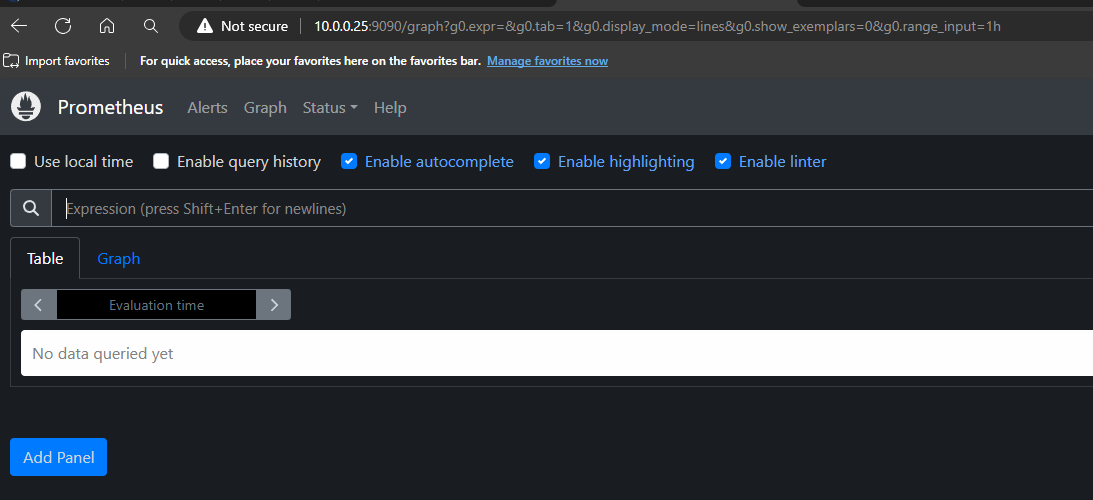
Confirm Prometheus is Running
-
Check if Prometheus is up and running by visiting
http://localhost:9090in your web browser.
-
You're Done
You’ve successfully installed and configured Prometheus on your system. Your Prometheus server is now up and running, ready to scrape metrics from the configured targets and provide insights into your system’s performance and health.