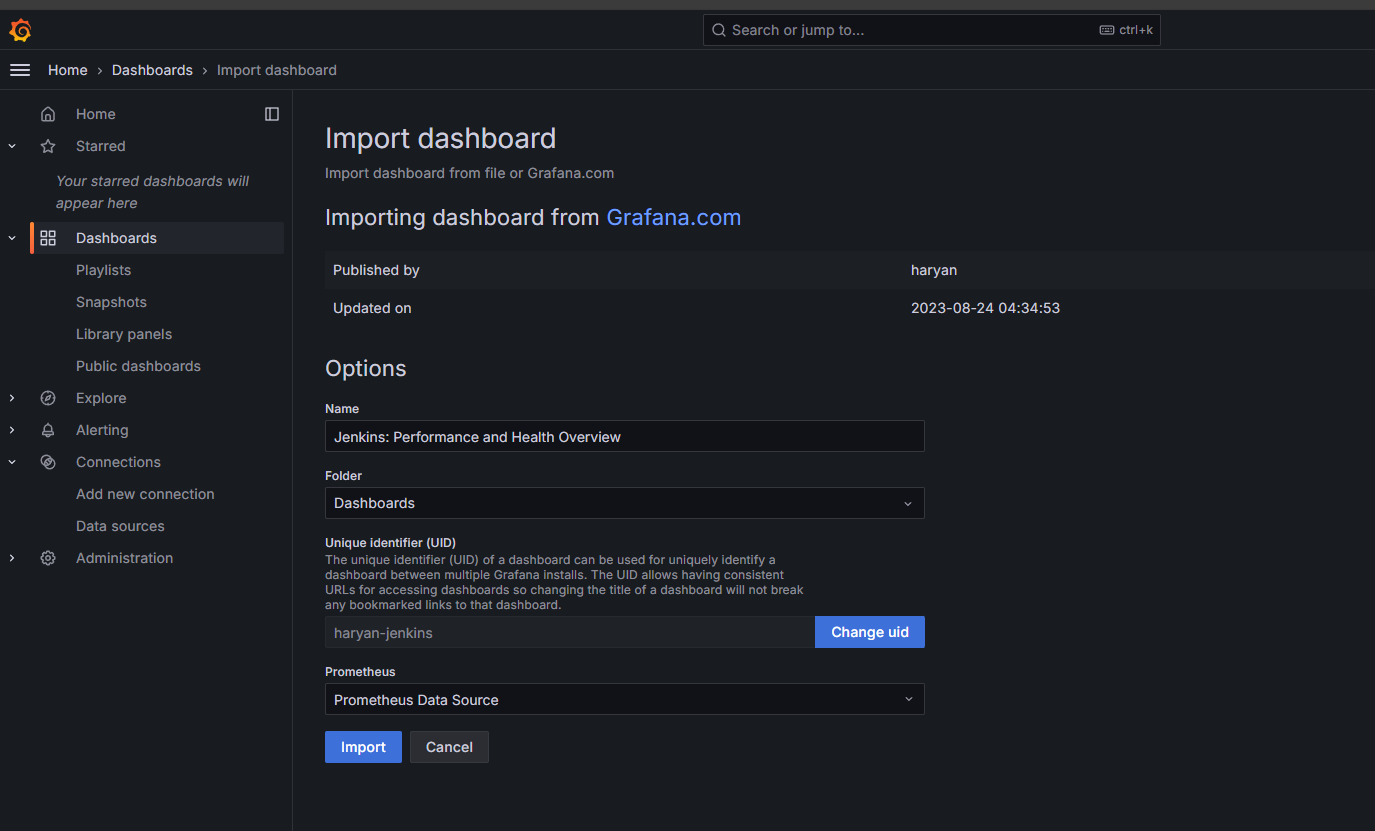
Installing a Grafana Dashboard for Jenkins
Overview
This installation process is for setting up a Jenkins performance and health overview dashboard in Grafana for monitoring purposes.
Prerequisites
-
Find the Dashboard:
- Browse various Jenkins-related Grafana dashboards here.
-
Import the Jenkins Performance and Health Overview Dashboard:
- The specific dashboard can be found here.
-
Import the Dashboard:
- Download or copy the dashboard JSON from the provided link.
- In Grafana, navigate to the dashboards section.
- Click on Import.
- Paste the JSON code or upload the JSON file.
- Complete the import process.

Installation Steps
-
Access Grafana:
- Open your Grafana instance in a web browser.
-
Import the Dashboard:
- Go to the Dashboards section.
- Click on the Import button.
- Either paste the JSON code or upload the JSON file you obtained earlier.
- Follow the prompts to complete the import.
Configuration Steps
-
Customize the Dashboard:
- Once imported, you can customize the dashboard to fit your specific monitoring needs.
-
Save the Configuration:
- Ensure that any changes made to the dashboard are saved.
Conclusion
Your Grafana dashboard for Jenkins performance and health overview is now set up and ready for use!